navigation bar to load
 ProControl® 6.3
Applied Statistics for Laboratories and Industry
in Excel
 in Deutsch
 en Español:Validation, Calibration, Spiking, Uncertainty in
Measurements, Trend Analysis, Trend Forecast, Uncertainty in Forecast
, Stability, Shelf Life, Maintenance
en Español:Validation, Calibration, Spiking, Uncertainty in
Measurements, Trend Analysis, Trend Forecast, Uncertainty in Forecast
, Stability, Shelf Life, Maintenance
Highlights of ProControl® - Special features and performance.
Standard features of ProControl® 6.3
- Statistical tests and characteristics compliant to DIN and ISO
standards
Excel standard worksheets provide the statistical evaluations of your
data.
ProControl®is compatible to all currently available Excel versions. - Interactive procedures, easy documentation of your results
Dialogue fields guide you through the possibilities and options under MS-Excel. - Immediate control of your measuring results
You type in a value and all calculations and results are immediately
actualised. - Your advantage is an instant access and overviews to all characteristics.
you immediately recognize and prove significant differences of results , series
of
inhomogeneous variances or outliers,.... - ....as well as comparing arithm. means, at no
further requirements to variances' homogeneity and at no moment's hesitation...
Differences of arithm. means are displayed whether variances are homogeneous or
not
The excellence is -- only supported by ProControl®:
- Prediction intervals on the abcissa scale......show and tell you instantly the range of uncertainty, where you should expect
reliable analytical results, reporting accuracy and precision by your first
calibration already.
- At the earliest time possible, you get an estamation for uncertainty in
measurements, provided in standard excel worksheets as well as graphically displayed.
Results are even provided for up to regressions of 4th. order, any weighting
supported too. It needs just one touch on the appropriate button of ProControl
command bars.
- Only provided by ProControl, or where else? Even some special statistics software use to focus only on evaluating the
confidence intervals and prediction ranges in scales of ordinate values. They
neglect any estimation of uncertainty in scales of the abscissa, which is
surely much more essential to evaluate analytical results or a trend forecast.
- New and unique world wide : Trend analysis and extrapolation with uncertainty included.Trend analysis is not reduced to simply analysing, proving, describe and
extrapolating. ProControl
supports evaluation of prediction limits in the abscissa scale (x-values), thus
providing an estimation of uncertainty even in extrapolation and forecast.
You choose the parameters, whether it should be a limiting
specification (value 'y') or limiting time (value 'x'), ...
ProControl even provides to
take any weighting into account. This way you get results of any forecast at
a
calculated risk, that you define (1% or 5% switch, or free at the input of your
choice).
ProControl is validated software. Reliability to ISO and DIN standard results
has
been proved. Although there are no standard results available for linear
regressions
that exceed 2nd. order, we were able to prove traceability of the applied
formulas to
existing standard references.
Extended features in evaluating calibration characteristics.
- Test for outliers of regression:
compliant to recommendations of DEV-documents
(Deutsche- Einheits-Verfahren).
To recognize and exclude outliers of the regression, where marking and
eliminated
outliers is justified, may avoid to encounter systematic deviations and errors
of
analytical results.
- Regression models, any commonly justified weighting supported: Apply, as justified, provided options to choose regression
order and weighting.
Thus
ProControl prevents you from evaluating wrong calibration characteristics, that
just
may arouse due to variability that was underestimated in your initial studies
(inhomogeneity of variances).
- Results displayed at your choice: Kenndaten der Regression,
Characteristics of the regression, Method characteristics compared to
DIN 32645-standard formulas applied,
Analytical results including uncertainty,
best regression model, on a statistical basis that meets your practice - it's
more than just testing linearity!
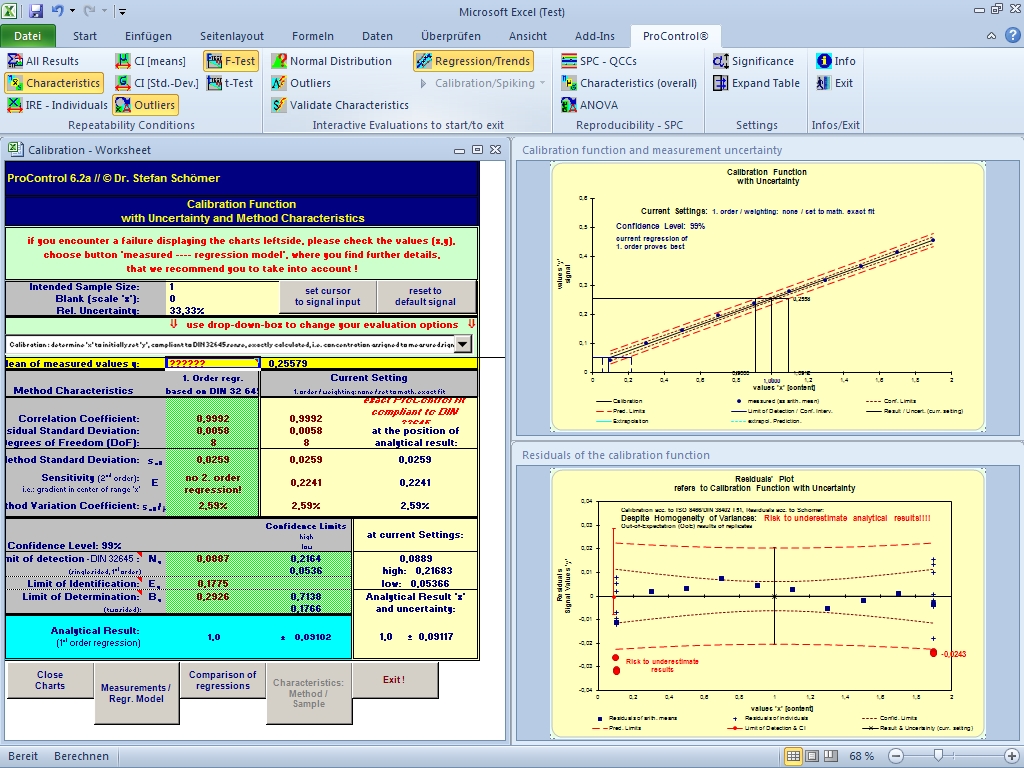
- Results display graphicallyCurrent measurements, calibration function with confidence and prediction
limits,
Residuals of all measured values explicitly,
Confidence and prediction limits in a residual scale (ProControl residual chart)
the analytical result, uncertainty in measurement included
Limits of decision (limit of detection), confidence interval
included.
Examples as screenshots:
ProControl® 6.3 demo download
ProControl® 6.3plus
The solution for extensive data arising in interlaboratory studies or process
control.
- ProControl®-plus included in the software package without any surcharge.The extended version of ProControl supports input
of
up to 700 measurements, i.e. results in 35 columns and 20 rows. Whether data
refer to
your interlaboratory study, proficiency testing, process control or pooled
stability studies.
ProControl® 6.3plus
should enable you to evaluate the desired statistics.
Further information:
Any questions? Pls. contact for ProControl®:Dr. Stefan Schömer
 previous pageHome|News|Objectives|Consulting|Trainings|Contact|Privacy